Instead of making posters about the carbon emission of printing. We wanted to make a system that really showed the impact of printing but in more fun and lightweight way.
The idea was to make an award system that showed the 5 different levels of carbon emissions in printing. Depending on the impact of the print, you get a different level. For example level 5 if your print has a smaller carbon emission and level 1 if the print has more carbon emission. We want to show that unseen differences that can be make by printing or switching your behaviour. The theme of garden/ flowers seemed like a good visualisation for making it more lightweight and fun.
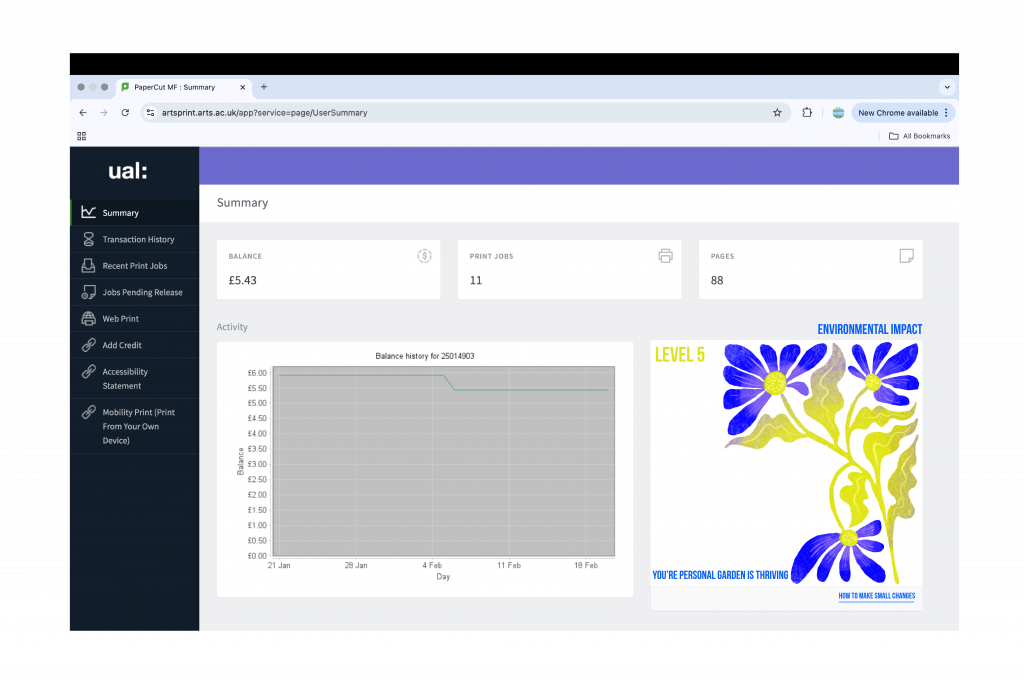
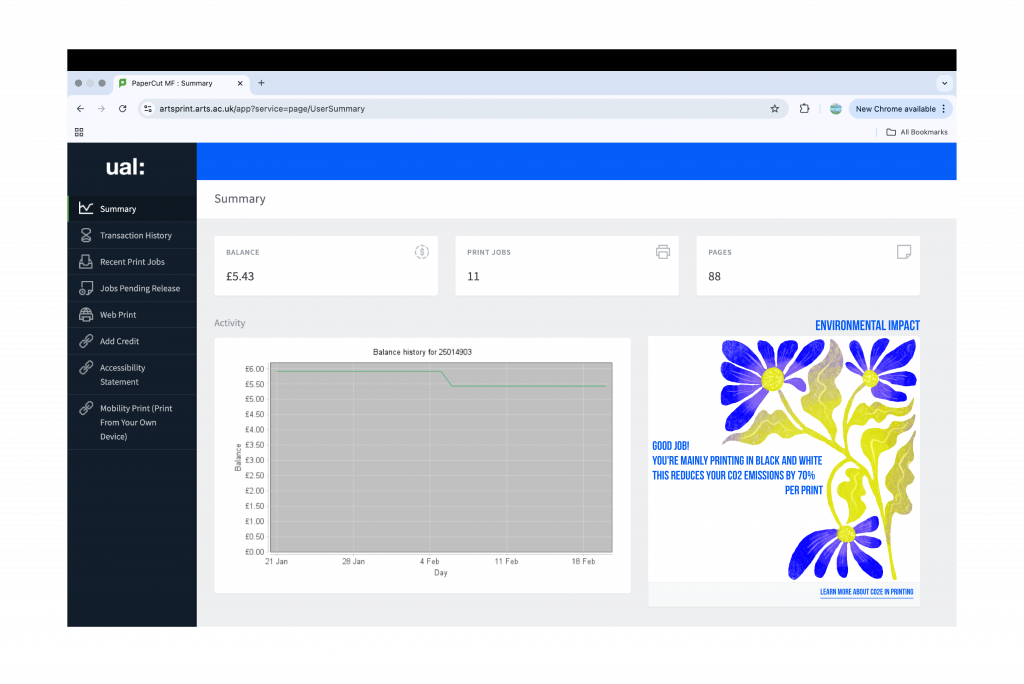
We saw that the paper cut portal already had an environmental dashboard. But the design and language that was used felt corporate and negative, So we took that as a starting point to see what we could change within the portal. We tried to integrate our visuals and tone of voice into it. We also wanted to add a carbon emission calculator where you could measure your print. By choosing the pinter, paper, colour and size you could se what would change to your carbon emissions if you pick a different paper of printer etc.
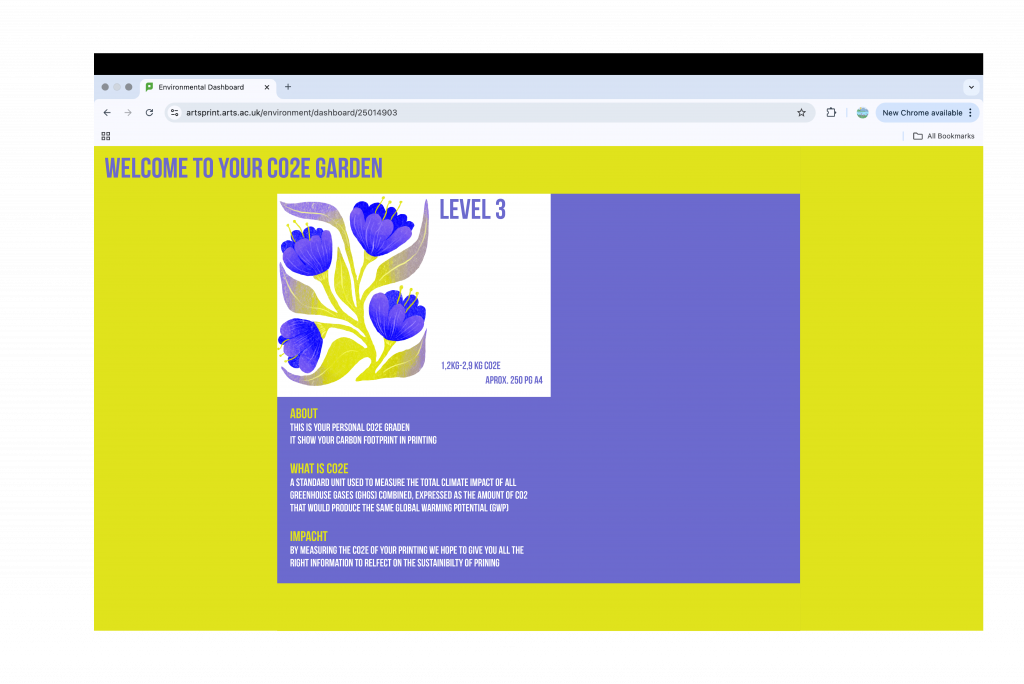
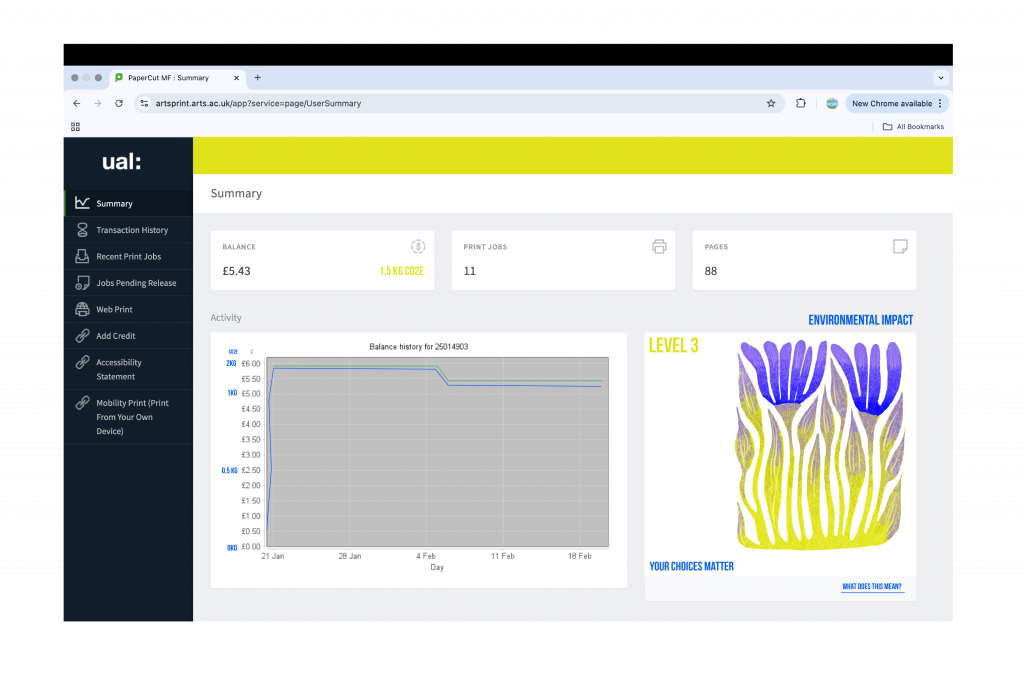
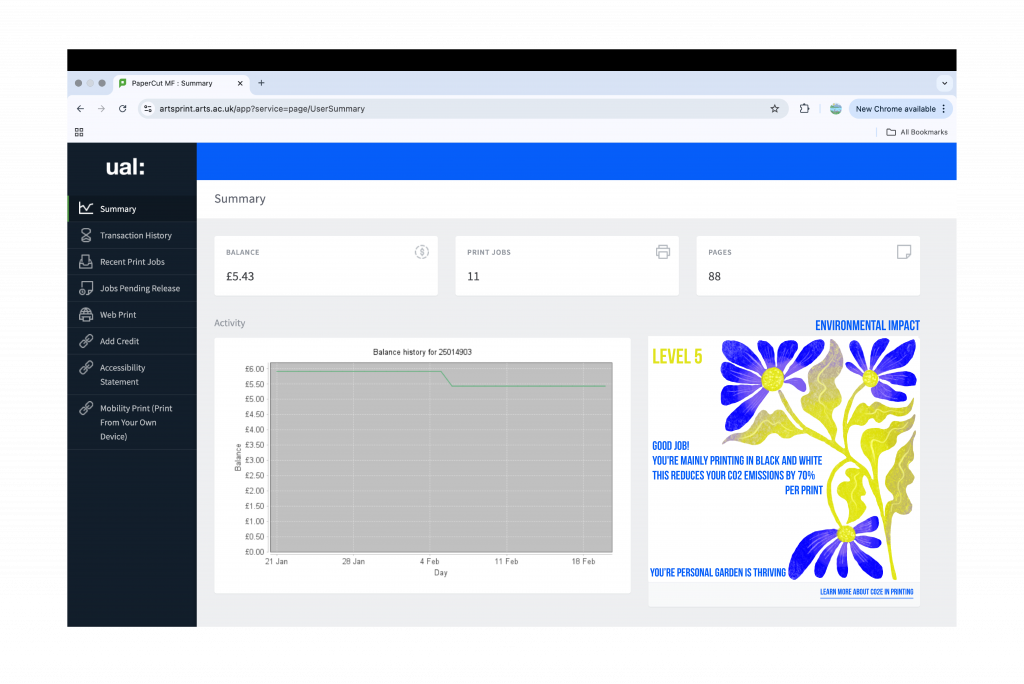
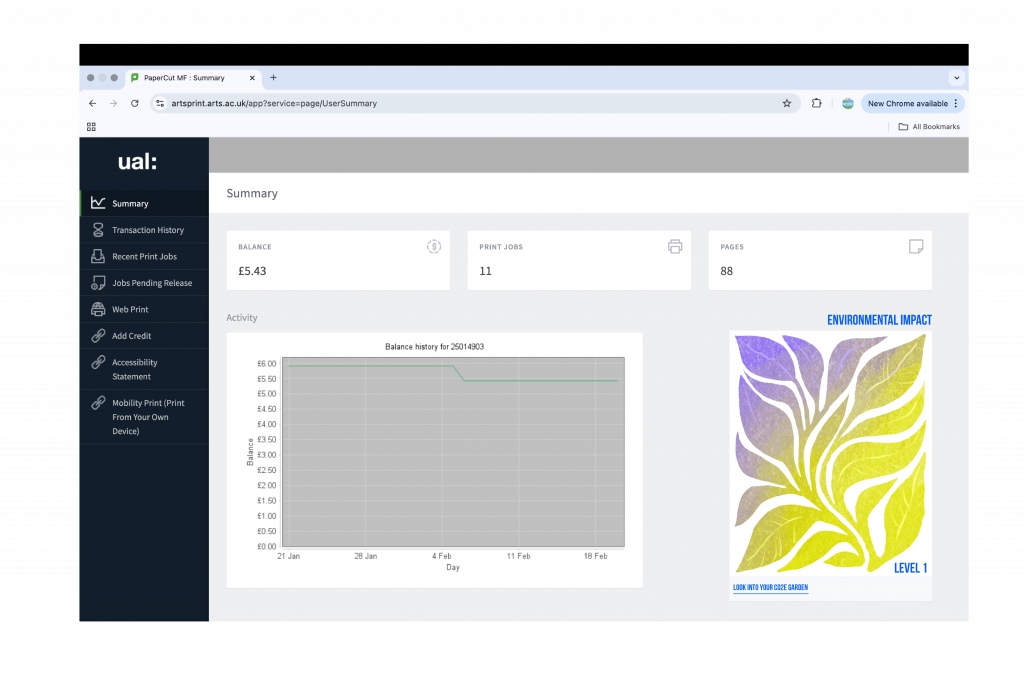
After playing with the paper cut portal we decided it would be more organised and easier if we made our own portal. We switched our colour palet to CMYK colours and black & white. The different garden levels would have either CMYK colour or black and white depending on the print the person printed.
We spliced the tasks: grey focused on the drawings and animations, Xiyan focused on the calculator and I focused the homepage, the scale it page and the overall flow of the website. But we agreed to help each other when someone would feel overwhelmed with the work.
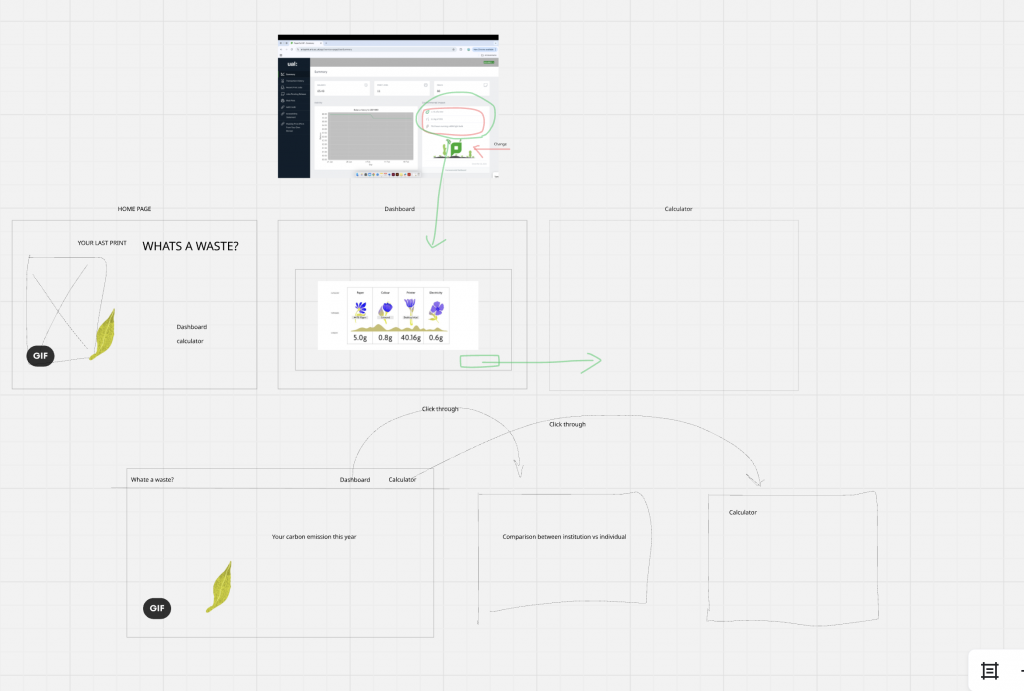
Different visual approaches for the home page:
Different visual approaches for the scale it page:
Final website design
What’s a waste of paper? Does disclosure change behaviour, or merely stylise the impact?
Sustainability data is usually available if you look for it, but it is rarely easy to see when making decisions. Although we can calculate CO₂e emissions, most people find these numbers hard to relate to in everyday situations. Our project examines how graphic communication design can clarify this information and help people change their behaviour.
Focusing on printing at UAL, we examined how carbon emissions are produced and distributed across individual and institutional scales by calculating the CO₂e cost of a single A3 poster. By measuring the CO₂e cost per printed page, we identified a disconnect: while financial costs are immediately visible through systems such as PaperCut, environmental costs are less visible.
Our aim became exploring ways to communicate this invisible information through a scaling system that gives individuals the power of choice while also contextualising that cost within larger networks.
Our method combined system mapping for carbon calculation, visual identity for displaying information, and interface prototyping. We developed a scaling framework to contextualise individual printing within a larger collective, translating numerical data into a relational visual form.
Our result, What’s a Waste, is a proposed website or app carbon calculator that works alongside PaperCut. The aim is not to discourage printing outright; we recognise it is necessary for both students and staff at UAL. With this tool, we can make carbon costs legible at the moment of decision and put that cost into context through cumulative tracking. This tool operates as a bridge between the individual and the institutional collective.
By positioning the disclosure of information as both a design strategy and a critical question, What’s a Waste tests whether visibility can positively influence behaviour or simply reframes participation within existing systems.
Leave a Reply